matplotlib.gridspec 是 Matplotlib 库中的一个模块,用于创建复杂的子图布局。GridSpec 提供了更精细的控制,允许你定义不同大小和位置的子图。下面是对 GridSpec 的详细介绍和一些常见用法示例:
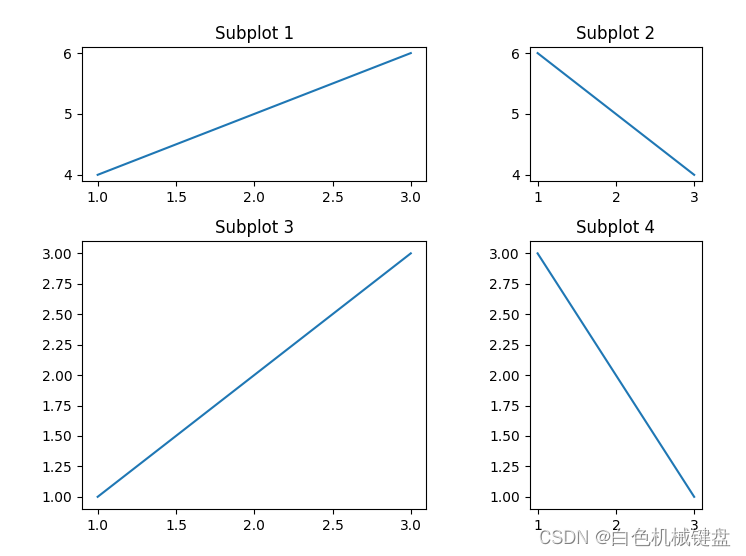
1. 基本用法
GridSpec 类似于表格布局,可以定义子图占据的行和列:
import matplotlib.pyplot as plt
import matplotlib.gridspec as gridspec
fig = plt.figure(figsize=(8, 6))
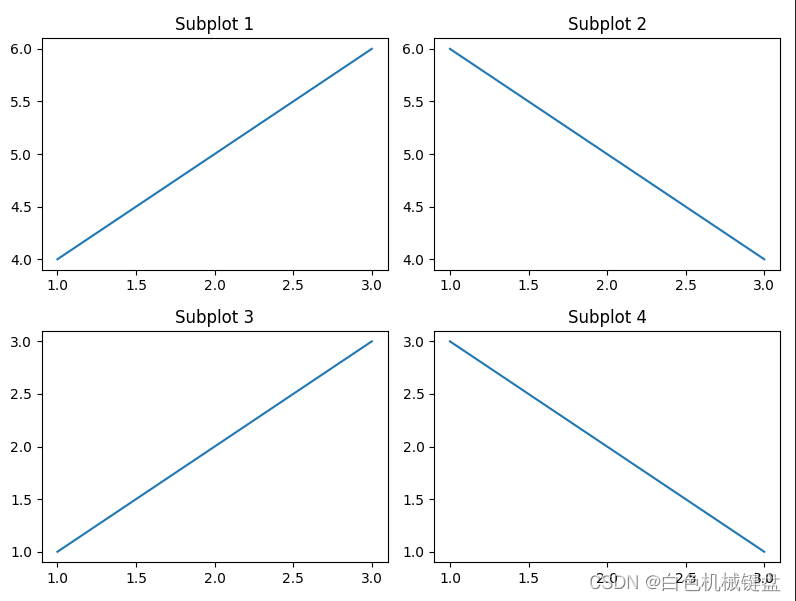
gs = gridspec.GridSpec(2, 2)
ax1 = fig.add_subplot(gs[0, 0])
ax1.plot([1, 2, 3], [4, 5, 6])
ax1.set_title('Subplot 1')
ax2 = fig.add_subplot(gs[0, 1])
ax2.plot([1, 2, 3], [6, 5, 4])
ax2.set_title('Subplot 2')
ax3 = fig.add_subplot(gs[1, 0])
ax3.plot([1, 2, 3], [1, 2, 3])
ax3.set_title('Subplot 3')
ax4 = fig.add_subplot(gs[1, 1])
ax4.plot([1, 2, 3], [3, 2, 1])
ax4.set_title('Subplot 4')
plt.tight_layout() # 调整布局
plt.show()
运行结果:
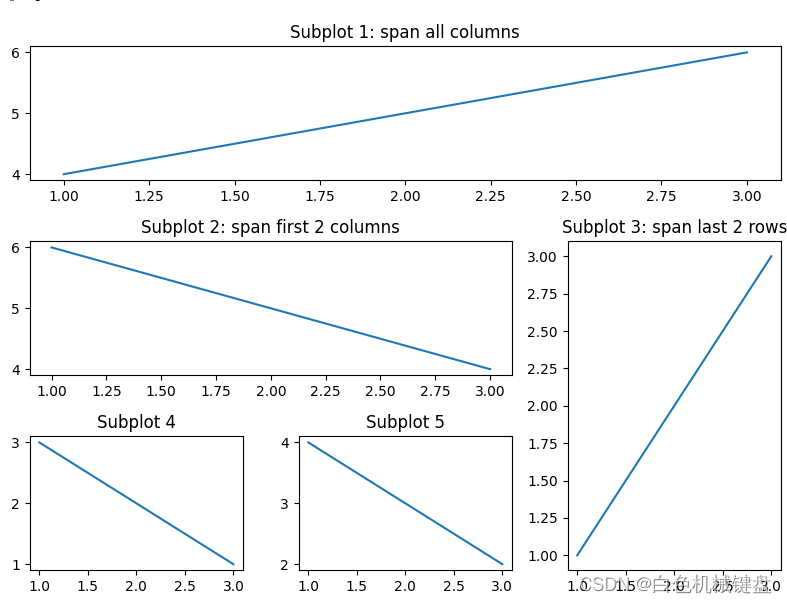
2. 子图跨行跨列
你可以通过切片语法让子图跨越多行或多列:
fig = plt.figure(figsize=(8, 6))
gs = gridspec.GridSpec(3, 3)

ax1 = fig.add_subplot(gs[0, :])
ax1.plot([1, 2, 3], [4, 5, 6])
ax1.set_title('Subplot 1: span all columns')

ax2 = fig.add_subplot(gs[1, :-1])
ax2.plot([1, 2, 3], [6, 5, 4])
ax2.set_title('Subplot 2: span first 2 columns')

ax3 = fig.add_subplot(gs[1:, -1])
ax3.plot([1, 2, 3], [1, 2, 3])
ax3.set_title('Subplot 3: span last 2 rows')

ax4 = fig.add_subplot(gs[-1, 0])
ax4.plot([1, 2, 3], [3, 2, 1])
ax4.set_title('Subplot 4')

ax5 = fig.add_subplot(gs[-1, -2])
ax5.plot([1, 2, 3], [4, 3, 2])
ax5.set_title('Subplot 5')

plt.tight_layout()
plt.show()
运行结果:
3. 调整子图间距
你可以使用 GridSpec 的参数调整子图之间的间距:
fig = plt.figure(figsize=(8, 6))
gs = gridspec.GridSpec(2, 2, width_ratios=[2, 1], height_ratios=[1, 2], wspace=0.4, hspace=0.3)

ax1 = fig.add_subplot(gs[0, 0])
ax1.plot([1, 2, 3], [4, 5, 6])
ax1.set_title('Subplot 1')

ax2 = fig.add_subplot(gs[0, 1])
ax2.plot([1, 2, 3], [6, 5, 4])
ax2.set_title('Subplot 2')

ax3 = fig.add_subplot(gs[1, 0])
ax3.plot([1, 2, 3], [1, 2, 3])
ax3.set_title('Subplot 3')

ax4 = fig.add_subplot(gs[1, 1])
ax4.plot([1, 2, 3], [3, 2, 1])
ax4.set_title('Subplot 4')

plt.tight_layout()
plt.show()
运行结果:
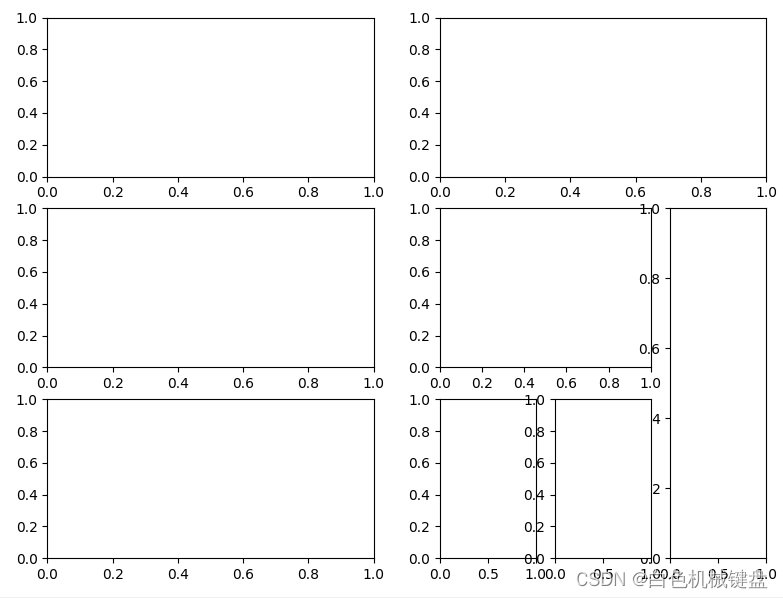
4. 嵌套的 GridSpec
你可以在一个子图中嵌套另一个 GridSpec:
fig = plt.figure(figsize=(8, 6))
gs0 = gridspec.GridSpec(1, 2)

gs1 = gridspec.GridSpecFromSubplotSpec(3, 1, subplot_spec=gs0[0])
ax1 = fig.add_subplot(gs1[0])
ax2 = fig.add_subplot(gs1[1])
ax3 = fig.add_subplot(gs1[2])

gs2 = gridspec.GridSpecFromSubplotSpec(3, 3, subplot_spec=gs0[1])
ax4 = fig.add_subplot(gs2[0, :])
ax5 = fig.add_subplot(gs2[1, :-1])
ax6 = fig.add_subplot(gs2[1:, -1])
ax7 = fig.add_subplot(gs2[-1, 0])
ax8 = fig.add_subplot(gs2[-1, -2])

plt.tight_layout()
plt.show()
运行结果:
总结
matplotlib.gridspec 提供了灵活的布局方式,允许用户创建复杂的子图排列。通过使用 GridSpec,你可以方便地调整子图的大小、位置以及跨越行和列的方式,从而实现更为复杂和美观的图表布局。